代码:1
2
3
4
5
6
7
8
9
10
11
12
13
14
15
16
17
18
19
20
21
22
23
24
25
26
27
28
29
30
31
32
33
34
35
36
37
38
39
40
41
42
43
44
45
46# -*- coding: utf-8 -*-
import matplotlib.pyplot as plt
import numpy as np
# 产生数据
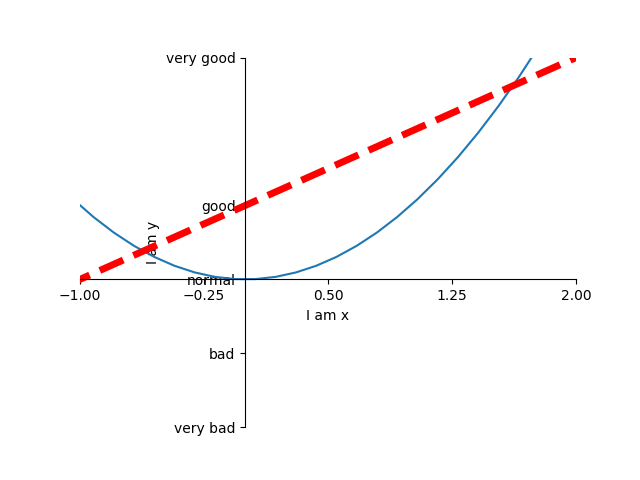
x = np.linspace(-3,3,50)
#绘制直线
y1 = x + 1
#绘制曲线
y2 = x**2
plt.figure()
# 单纯直线
plt.plot(x,y2)
# 指定线的颜色, 宽度和类型
plt.plot(x,y1,color='red',linewidth=5.0,linestyle='--')
# 设置坐标轴
plt.xlim(-1,2)
plt.ylim(-2,3)
plt.xlabel('I am x')
plt.ylabel('I am y')
new_ticks= np.linspace(-1,2,5)
# 设置坐标的粒度
plt.xticks(new_ticks)
# 用文字代替对应的数值
plt.yticks([-2,-1,0,1,3],
['very bad','bad','normal','good','very good'])
# gca = 'get current axis'
ax = plt.gca()
ax.spines['right'].set_color('none')
ax.spines['top'].set_color('none')
ax.xaxis.set_ticks_position("bottom")
ax.yaxis.set_ticks_position("left")
ax.spines['bottom'].set_position(('data',0))
ax.spines['left'].set_position(('data',0))
plt.savefig("/home/xuleilx/workspace/github/github_pages/public/images/axis_2.png")
#显示
plt.show()
结果: