代码:1
2
3
4
5
6
7
8
9
10
11
12
13
14
15
16
17
18
19
20
21
22
23
24
25
26
27
28
29
30
31
32
33
34
35
36
37
38
39
40
41
42
43
44
45
46
47
48
49
50
51# -*- coding: utf-8 -*-
import matplotlib.pyplot as plt
import numpy as np
# 产生数据
x = np.linspace(-3,3,50)
#绘制直线
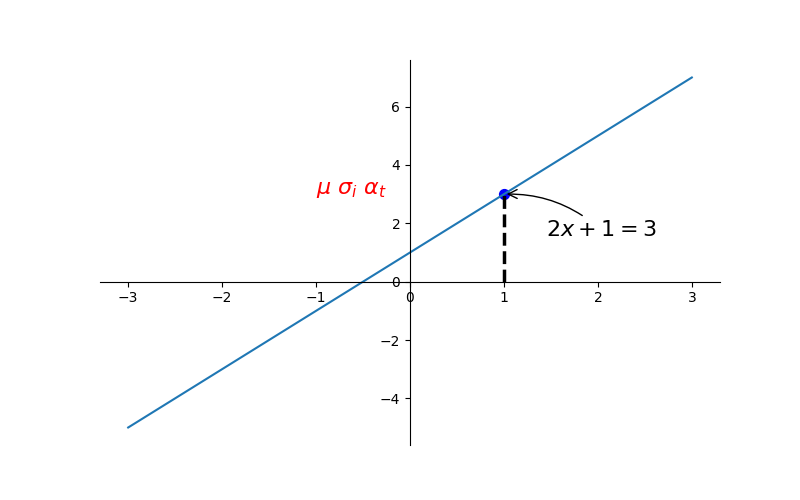
y = 2*x + 1
plt.figure(num=1,figsize=(8,5))
# 单纯直线
plt.plot(x,y)
# gca = 'get current axis'
# 移动坐标轴位置
ax = plt.gca()
ax.spines['right'].set_color('none')
ax.spines['top'].set_color('none')
ax.xaxis.set_ticks_position("bottom")
ax.yaxis.set_ticks_position("left")
ax.spines['bottom'].set_position(('data',0))
ax.spines['left'].set_position(('data',0))
x0 = 1
y0 = 2*x0+1
# x:[x0,x0],y:[0,y0] 矩阵运算
plt.plot([x0,x0],[0,y0],'k--',linewidth=2.5)
# set dot styles
plt.scatter([x0,],[y0,],s=50,color='b')
# 添加标注
# method1
plt.annotate(r'$2x+1=%s$'%y0,
xy=(x0,y0),
xycoords='data',
xytext=(+30,-30),
textcoords='offset points',
fontsize=16,
arrowprops=dict(arrowstyle='->',
connectionstyle='arc3,rad=.2'))
# method2
plt.text(-1,3,
r'$\mu\ \sigma_i\ \alpha_t$',
fontdict={'size':16,'color':'r'})
plt.savefig("/home/xuleilx/workspace/github/github_pages/public/images/annotation.png")
#显示
plt.show()
结果: