代码:1
2
3
4
5
6
7
8
9
10
11
12
13
14
15
16
17
18
19
20
21
22
23
24
25
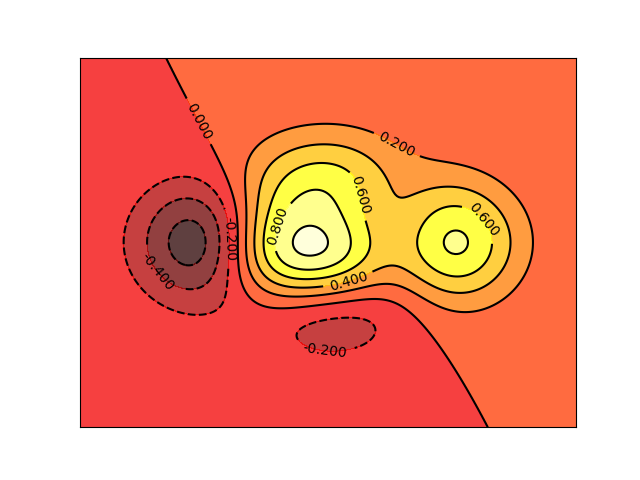
26# -*- coding: utf-8 -*-
import matplotlib.pyplot as plt
import numpy as np
def f(x,y):
# the height function
return (1-x/2+x**5+y**3)*np.exp(-x**2-y**2)
n = 256
x = np.linspace(-3,3,n)
y = np.linspace(-3,3,n)
# 编织成栅格
X,Y = np.meshgrid(x,y)
# use plt.contourf to filling contours
# X,Y and value for (X,Y) point
plt.contourf(X,Y,f(X,Y),8,alpha=.75,cmap=plt.cm.hot)
C = plt.contour(X,Y,f(X,Y),8,colors='black',linewidth=.5)
# 添加label,隐藏坐标轴
plt.clabel(C,inline=True,fontsize=10)
plt.xticks(())
plt.yticks(())
plt.savefig("/home/xuleilx/workspace/github/github_pages/public/images/contours.png")
plt.show()
结果: