代码:1
2
3
4
5
6
7
8
9
10
11
12
13
14
15
16
17
18
19
20
21
22
23
24
25
26
27
28# -*- coding: utf-8 -*-
import matplotlib.pyplot as plt
fig = plt.figure()
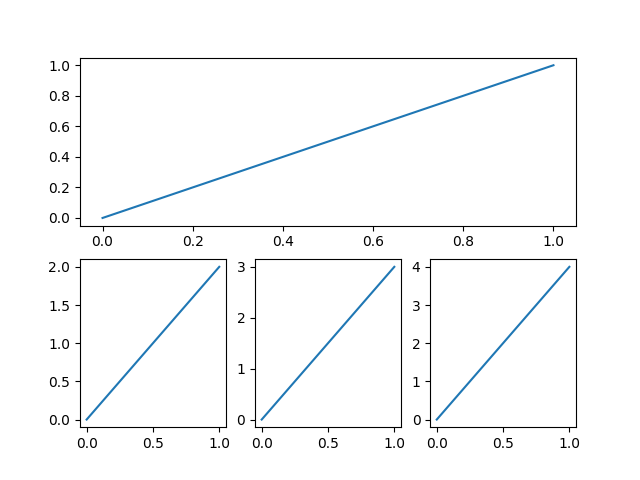
# 使用plt.subplot(2,1,1)将整个图像窗口分为2行1列, 当前位置为1.
# 使用plt.plot([0,1],[0,1])在第1个位置创建一个小图.
plt.subplot(211)
plt.plot([0,1],[0,1])
# 使用plt.subplot(2,3,4)将整个图像窗口分为2行3列, 当前位置为4.
# 使用plt.plot([0,1],[0,2])在第4个位置创建一个小图.
#
# 这里需要解释一下为什么第4个位置放第2个小图. 上一步中使用plt.subplot(2,1,1)将整个图像窗口分为2行1列,
# 第1个小图占用了第1个位置, 也就是整个第1行. 这一步中使用plt.subplot(2,3,4)将整个图像窗口分为2行3列,
# 于是整个图像窗口的第1行就变成了3列, 也就是成了3个位置, 于是第2行的第1个位置是整个图像窗口的第4个位置.
plt.subplot(234)
plt.plot([0,1],[0,2])
plt.subplot(235)
plt.plot([0,1],[0,3])
plt.subplot(236)
plt.plot([0,1],[0,4])
plt.savefig("/home/xuleilx/workspace/github/github_pages/public/images/subplot.png")
plt.show()
结果: